
In Part I of this series, we established why functional composite scales occupy a privileged position among ALS outcome measures: they sample across biological subsystems simultaneously, they are feasible to administer at scale, and they change detectably within the timeframe of a clinical trial. The ALSFRS-R, introduced by Cedarbaum and colleagues in 1999, became the field’s answer to these requirements. Over the following twenty-five years it accumulated a track record that no alternative can currently match in terms of sheer breadth of evidence. Understanding both why it succeeded and where it is failing is essential context for anyone interpreting ALS trial results — or designing new ones.
The scale in brief#
The ALSFRS-R consists of 12 items spanning four functional domains: bulbar function (speech, salivation, swallowing), fine motor function (handwriting, cutting food, dressing), gross motor function (turning in bed, walking, climbing stairs), and respiratory function (dyspnoea, orthopnoea, respiratory insufficiency). Each item is scored on a 0–4 ordinal scale, yielding a total score between 0 and 48. A score of 48 represents normal function; decline toward zero tracks progressive disability. In most natural history cohorts, patients lose approximately 1 point per month on average, though individual trajectories vary enormously.
Administration takes 5–10 minutes and can be completed by telephone, which proved critical for large multisite trials and, later, for decentralised study designs. The scale requires no specialist equipment and minimal rater training, making it deployable in clinical settings that would not support formal strength or respiratory testing.
What the ALSFRS-R does well#
Its primary virtue is sensitivity to change relative to survival endpoints. Functional decline precedes death by months to years, meaning the ALSFRS-R captures treatment-relevant signal in a timeframe that survival analysis simply cannot. The ALSFRS-R is among the most robust clinical predictors of survival in ALS, supporting its widespread use as a measure of disease trajectory.1
Reliability is reasonable when the scale is administered under standardised conditions. Interrater agreement is acceptable for most items, and the telephone administration format, while initially controversial, was shown to produce results comparable to in-person assessment.2 For an international disease with rare, geographically dispersed patients, this is not a minor advantage.
The scale’s ubiquity is itself a strength, though an uncomfortable one to acknowledge. Because the ALSFRS-R has been used in virtually every ALS clinical trial for over two decades, it enables cross-trial comparisons, natural history modelling, and retrospective analyses that would be impossible with a fragmented measurement landscape. Any new scale will take years to accumulate comparable evidence. The ALSFRS-R’s dominance is path-dependent, but the path dependency is real.
Where it breaks down#
The list of limitations is long enough to constitute its own indictment. Some are well-recognised, and careful trials guard against them. But familiarity with a scale’s weak points cuts both ways: little in the methodology stands between a known weakness and a study designed to lean on it. Still others are probably underappreciated — and may be lurking in the bottomless pit that seems to swallow every promising trial on its way from phase II to phase III:
Interrater variability is the limitation most often cited and, in practice, most often dismissed. Agreement under standardised conditions is genuinely good — but that is the wrong frame. What matters for trial inference is whether the residual noise from rater interpretation, site practices, and administration drift is small relative to the changes trials are powered to detect. Pooled multicentre data show that around 12% of patients exhibit implausible ≥5-point increases between consecutive visits, with prevalence by site ranging from 0% to 83% — variability of the same magnitude as plausible treatment effects.3
Treatment-induced score changes unrelated to neurodegeneration are another well-recognised problem, but one whose significance for analysis deserves more attention than it gets. The scale registers clinical management as if it were disease biology, and it does so in both directions. Non-invasive ventilation (NIV) lowers the respiratory subscale — initiating nocturnal BiPAP progressively drops item R3 from 4 to 2, and tracheostomy drops it to 0 — not because the underlying disease has worsened, but because the scale penalizes the intervention itself; the direction of bias is therefore counterintuitive, in that care pathways that prolong survival into ventilator-dependent stages appear to accelerate ALSFRS-R decline. In the opposite direction, symptomatic interventions like anticholinergics or botulinum toxin for sialorrhoea mechanically improve the salivation item without altering disease biology. When such interventions are used differentially between arms — or simply initiated at different rates — the ALSFRS-R conflates genuine neuroprotection with symptomatic management, and in the NIV case can actively obscure it. With the small sample sizes typical of ALS trials, randomisation cannot be relied on to balance the arms on these factors; and because management practices vary between centres, the resulting imbalance is difficult to correct for after the fact.
Poor standardisation across sites and trials remains a persistent issue despite published guidelines. The wording of individual items has varied across versions and translations; the threshold between adjacent scores is interpreted inconsistently; and the phone administration protocol is not uniformly applied. None of these individually are catastrophic, but collectively they add noise to an already noisy signal.
Floor and ceiling effects compress detectable variation at the extremes of the scale: patients with early-stage or slowly progressive disease cluster near 48, while end-stage patients reach 0 on multiple items well before death, making the final months of disease nearly invisible to the scale. Most of this is neutralised in practice by the enrollment criteria of typical trials, which routinely exclude very slow progressors and very advanced patients — but what remains of the floor effect interacts with informative censoring (below) and with trajectory non-linearity to distort treatment-effect estimates near the end of follow-up.
Informative censoring due to death is a problem that is statistically serious and has traditionally been handled inadequately. Patients who die during a trial are censored from longitudinal ALSFRS-R analyses at their last observed score — but death is not missing at random. It is the terminal expression of the very process the scale is trying to measure. Standard mixed-effects models that ignore this mechanism produce biased estimates of treatment effects, typically in the direction of underestimating decline and therefore underestimating treatment benefit. The appropriate analytical tools — joint models for longitudinal and survival data, pattern mixture models — exist and are used in some trials but have only recently become standard.4
The ordinality problem: why one point is not always one point#
Two limitations deserve deeper treatment because they are methodologically distinct, frequently conflated, and together undermine the statistical foundations of most ALSFRS-R analyses.
The first is the ordinal structure of the scale. Each item is scored 0–4, but there is no reason to assume — and considerable evidence to doubt — that the functional difference between a score of 3 and 4 is equivalent to the difference between 1 and 2. The items are anchored to qualitative descriptions, not to physical measurements, and the spacing between anchors reflects clinical judgement rather than any psychometric calibration.
The figure below illustrates this concretely using the bulbar subdomain — speech, salivation, and swallowing — whose three items have strikingly different functional architectures. On the salivation item, a score of 2 represents barely perceptible excess secretion: the patient has lost very little functional capacity relative to the full range of the item. On the swallowing item, a score of 2 means the patient can no longer eat a normal diet and is approaching tube feeding — a profound functional transition. Yet both scores contribute identically to the bulbar subdomain total. When all three items score 2, the subdomain total is 6 regardless of which items drove the decline and how much function was actually lost along the way.
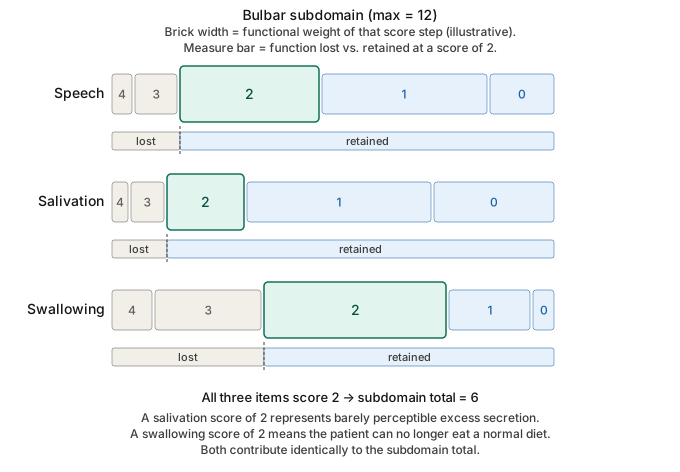
The practical consequence is that treating the ALSFRS-R total score as a continuous, interval-level variable — as virtually all linear mixed-effects models do — is a modelling assumption that is unlikely to hold. A one-point difference at different points on the scale does not represent the same quantity of disease. The total score aggregates these inequalities across 12 items, compounding the distortion. When we fit a model and report a treatment effect of “0.3 points per month,” that number is an average over a heterogeneous set of functional transitions that may have very different clinical meanings.
A one-point difference at different points on the scale does not represent the same quantity of disease. […] When we report a treatment effect of “0.3 points per month,” that number is an average over a heterogeneous set of functional transitions that may have very different clinical meanings.
Non-linearity of the decline trajectory#
The second problem is about time rather than scale. The conventional analysis — a mixed-effects model with a linear term in time, the workhorse of ALSFRS-R trials — has each patient declining at a roughly constant rate, so that a treatment effect collapses to a single difference in slopes: “points per month.” Nothing in the mixed-model framework forces this; the “linear” in linear mixed model refers to linearity in the parameters, not to a straight-line trajectory. It is simply the specification almost everyone reaches for.
The problem is that empirically the decline is not constant. Individual trajectories tend to be gently sigmoidal — a shallower phase early on, a steeper middle, a flattening near the floor as items bottom out one by one — and the instantaneous rate varies systematically between patients with baseline score, symptom duration at entry, and onset region. A cohort slope is therefore an average over curves of different shapes, not just different steepness.
Whether that matters over the length of a real trial is a fair question, and the answer is: usually less than one might fear, which is exactly why the linear model has survived. A phase II often runs six months and a phase III a year or more; over a window that short, a single patient’s trajectory is frequently close enough to a straight line that the misspecification is second-order. The real exposure is cohort composition: when patients enter at a range of disease stages, the trial pools shallow early segments with steep mid-disease ones, and if the arms are not perfectly balanced on stage — which, at ALS sample sizes, they often are not — the estimated slope difference quietly absorbs some of that imbalance. Longer trials, lead-in periods, and designs that lean on a pre-randomisation slope (for enrichment or as a covariate) make the curvature harder to ignore, since that pre-slope is itself a straight line fitted to a curved segment.
So why not reach for splines, a quadratic term, or a proper nonlinear progression model? The obstacles are mostly not statistical:
Interpretability. “The drug slowed decline by 0.3 points per month” is a sentence a clinician, a patient, and a regulator can all act on; a time-by-treatment interaction gives an effect that changes over follow-up, which is harder to headline. That part is fixable — collapse it back to one number, e.g. the difference in area under the trajectory over the fixed window, arguably a fairer summary of cumulative benefit than a slope. What remains is that this number is a modelling choice rather than a reading off the data, and a less familiar quantity than the slope regulators have decades of experience interpreting — so the resistance here is conventional, more than it is statistical.
Overfitting. Flexibility is not free. With a few hundred patients per arm, a handful of visits each, and substantial dropout, there is often not enough information per patient to estimate curvature stably; knot count and placement turn into tuning knobs, and the conclusions can move with them. A misspecified-but-stable linear fit can beat a flexible-but-noisy one at the job that matters here — detecting a between-arm difference.
Pre-specification and inertia. The accepted primary analysis is a pre-specified mixed model with a linear time term — the “rate of decline” slope. A nonlinear primary endpoint is a harder sell at a regulatory meeting and has little precedent, so even the groups that do fit sigmoidal or disease-progression models tend to keep them in a secondary or descriptive role.
The honest summary is that linearity is a known approximation whose error is usually small over a fixed, enrichment-narrowed trial window — but “usually small” is not “negligible,” the error is rarely quantified, and it compounds with informative censoring and floor effects precisely where the data are thinnest. The defensible responses are unglamorous: keep the follow-up window short enough that the approximation holds, stratify or adjust for baseline progression rate, and look at the residuals for curvature rather than assuming it away.
Summary of limitations and trial consequences#
| Limitation | Mechanism | Trial consequence | Mitigation |
|---|---|---|---|
| Interrater variability | Inconsistent threshold interpretation between raters and sites | Inflated residual variance; reduced power | Rater training, centralised scoring, telephone administration protocols, self-administered methodologies |
| NIV / symptomatic treatment confounding | Interventions influence subscale scores unrelated to neurodegeneration | Spurious treatment effect if differential use between arms | Pre-specified covariate adjustment; separate reporting of respiratory subscale |
| Poor standardisation | Item wording, scoring anchors, administration protocol vary across sites and versions | Measurement error; limits cross-trial comparability | Strict protocol adherence; single validated version per trial; self-explanatory scoring sheets |
| Floor / ceiling effects | Score compression at boundaries of the scale | Reduced sensitivity at disease extremes; residual floor effect interacts with censoring | Enriched enrollment; early trial entry criteria |
| Informative censoring | Death is non-random and correlated with outcome trajectory | Biased estimates under standard mixed models; underestimation of decline | Joint longitudinal-survival models; pattern mixture models — rarely applied in practice |
| Ordinal scale treated as continuous | Unequal functional weight of steps across items and score range | Loss of interpretability; potential bias in effect estimates | None within the scale as currently used |
| Non-linearity | Sigmoidal individual trajectories; rate varies with disease stage | Misspecified linear models; slope difference absorbs arm imbalance on stage | Short follow-up windows; baseline progression-rate stratification; nonlinear modelling (rarely the primary endpoint) |
| Multidimensionality | Domains reflect distinct biological processes with potentially different treatment responses | Domain-specific effects cancelled by aggregation; false negatives | None within a total score framework — requires modeling subdomain scores |
The last row of that table — multidimensionality — is listed here for completeness, but it warrants a dedicated discussion. It is, in my view, the most consequential and least adequately addressed limitation in the current trial literature, and it is the subject of Part III.
Kimura et al. (2006). Progression rate of ALSFRS-R at time of diagnosis predicts survival time in ALS. ↩︎
Kaufmann et al. (2007). Excellent inter-rater, intra-rater, and telephone-administered reliability of the ALSFRS-R in a multicenter clinical trial. ↩︎
Bakers et al. (2022). Using the ALSFRS-R in multicentre clinical trials for amyotrophic lateral sclerosis: potential limitations in current standard operating procedures. ↩︎
van Eijk et al. (2022). Joint modeling of endpoints can be used to answer various research questions in randomized clinical trials. ↩︎